Leaderboard
The Leaderboard displays securities within the defined universe ranked according to MarketQuants' proprietary quantitative metrics.
Ranking System
- Display Range: The top-ranked securities are shown by default. Expanded visibility may be available depending on subscription level.
- Composite Score: Securities are ordered based on their Composite Score, a mathematical ranking model.
- Price Updates: Market prices update periodically during market hours.
Tile Layout
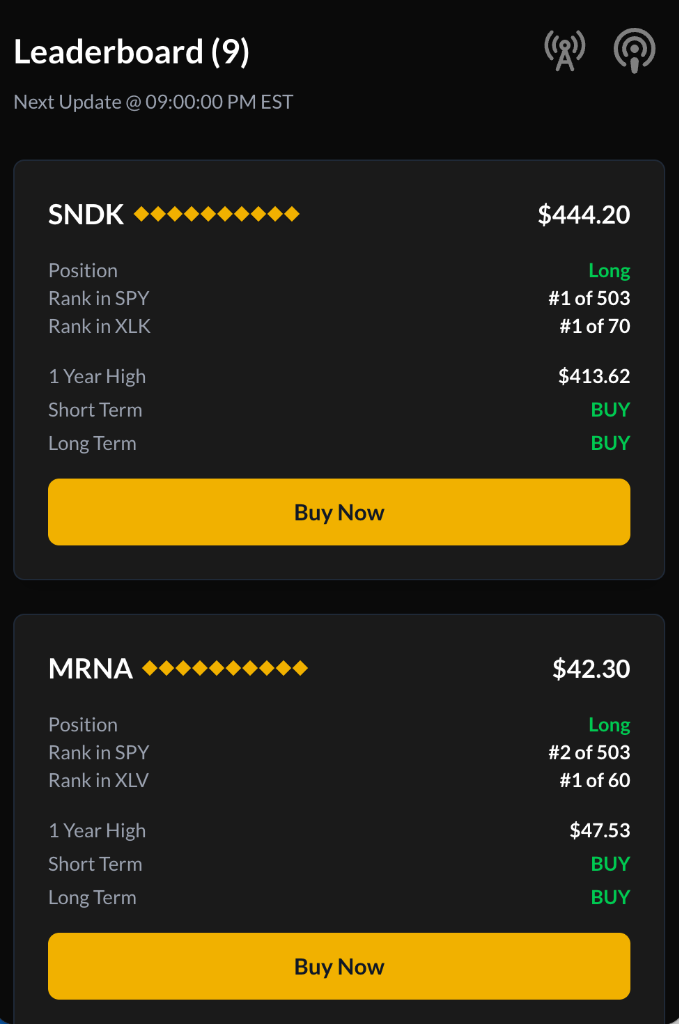
Each tile presents structured analytical data:
Header
- Ticker Symbol
- Diamond Score (visual structural indicator)
- Latest available price
Metrics
- Position Status: Indicates whether the connected portfolio currently holds the security.
- Rank (Universe): Position within the ranked universe.
- Rank (Sector): Position within its sector.
- 1-Year High: Highest closing price over the previous 12 months.
Quantitative Status Labels
Each security displays a status label derived from predefined moving-average relationships:
- BUY: Price above defined short-term and long-term moving averages.
- CASH: Price between defined averages.
- SELL: Price below defined short-term and long-term moving averages.
These labels reflect model-derived conditions and do not constitute recommendations to buy, sell, or hold any security.
Navigation & Actions
- Trading Interface: Opens the order submission interface for connected brokerage accounts.
- Information Card: Selecting the tile background opens additional analytical details.
Additional Reports
- Market Brief: Short-form market summary.
- Deep Dive: Extended market overview.
These reports provide general market commentary and are for informational purposes only.