Portfolio Efficiency
The Portfolio Efficiency view provides analytical metrics describing the structural composition of your portfolio relative to a benchmark universe.
This feature is informational only and does not constitute investment advice.
1. The Metrics
Efficiency Score
The Efficiency Score reflects how your current portfolio distribution compares to a predefined benchmark model.
- Calculation: The score evaluates relative sector allocation and position concentration based on internal quantitative rules.
- Higher values indicate closer alignment with the benchmark structure.
Meaningful Positions
This metric identifies positions that represent a proportionally significant share of total portfolio value.
A position classified as “meaningful” meets a predefined threshold within the portfolio structure.
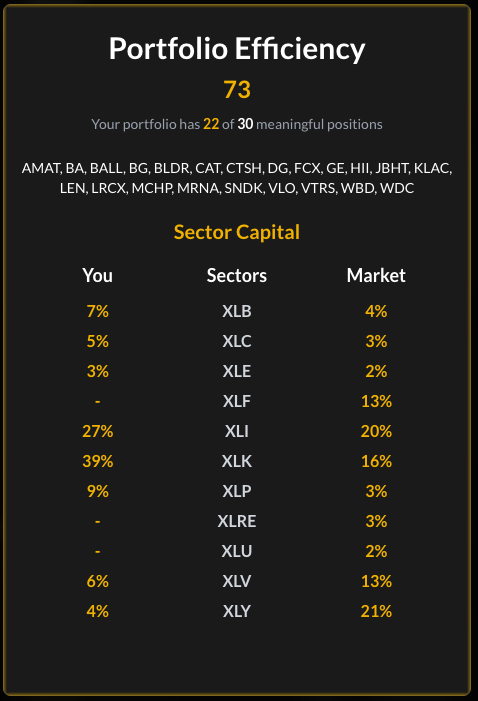
2. Sector Allocation Comparison
The table displays a comparison between:
- Your Portfolio Allocation
- Sector Classification
- Benchmark Allocation
This comparison highlights differences between your portfolio and the selected benchmark.
Portfolio allocation decisions remain entirely at the discretion of the user.
Important Note
MarketQuants provides structural analysis tools only.
MarketQuants does not recommend specific allocations, securities, or trading strategies.