My Portfolio
The My Portfolio section provides a consolidated view of portfolio data retrieved from connected brokerage accounts or simulated (paper) environments.
MarketQuants is an independent software platform and does not provide brokerage or custody services.
Portfolio Overview
The Portfolio section is organized into three components (“Shells”) for visualization purposes.
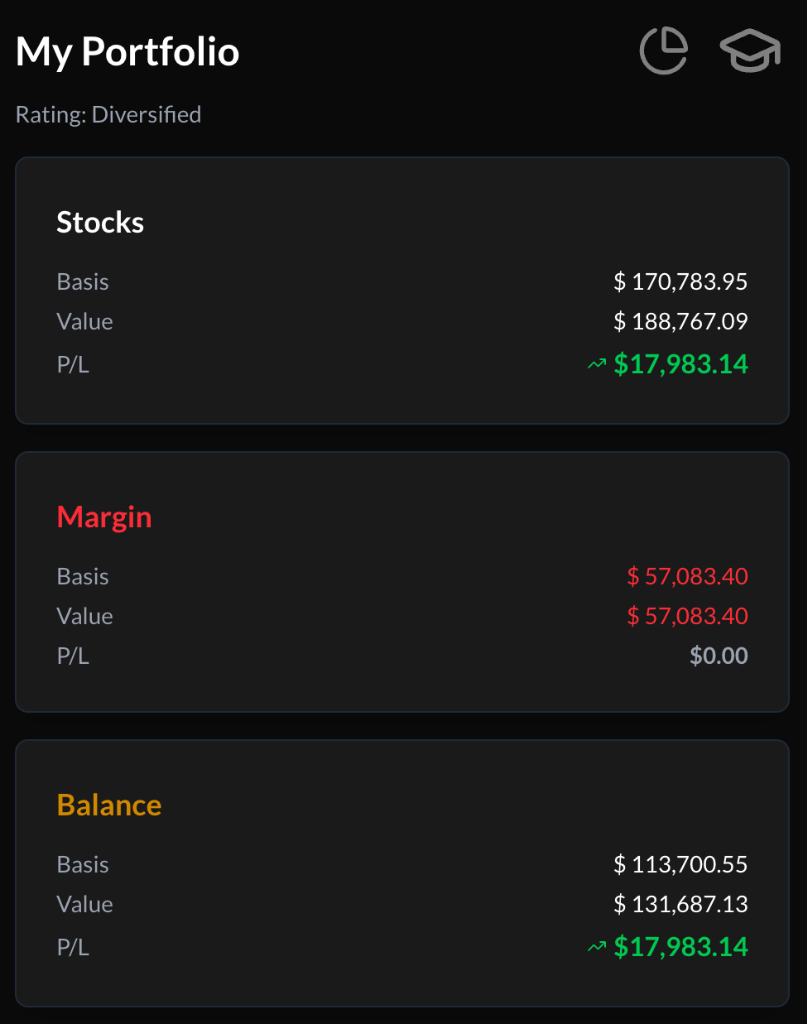
Each shell displays:
- Cost Basis
- Market Value
- Unrealized Profit / Loss
Values are sourced from connected brokerage data where applicable.
1. Stocks Shell
Displays the aggregate market value of equity holdings within the supported analysis universe.
MarketQuants focuses on a defined stock universe for ranking and comparison purposes.
2. Cash Shell
Displays available buying power as reported by the connected brokerage account.
If margin is enabled at the brokerage level, this may be reflected in the cash display.
MarketQuants does not provide margin services.
3. Balance Shell
Displays total portfolio value based on reported equity and cash components.
Brokerage Integration
To enable live trading functionality, users may optionally connect a supported third-party brokerage account through secure authorization.
MarketQuants:
- Does not open brokerage accounts
- Does not hold funds
- Does not execute trades independently
- Is not affiliated with any brokerage provider
All trade execution and account services are performed solely by the brokerage provider.
Portfolio Structure Classifications
MarketQuants provides informational portfolio classifications based on:
- Number of positions
- Sector distribution
These classifications are descriptive analytics and do not constitute investment advice.
| Ticker Count | Sector Exposure | Classification |
|---|---|---|
| 0 | 0 | Undecided |
| 3–8 | < 3 | Speculative |
| 9–17 | 3+ | Concentrated |
| 18–35 | 3+ | Diversified |
| 36–44 | 3+ | Losing Focus |
| 45+ | 3+ | Overbuilt |
Navigation
- Pie Chart Icon → Portfolio Efficiency analysis
- Hat Icon → Educational resources (Quant School)