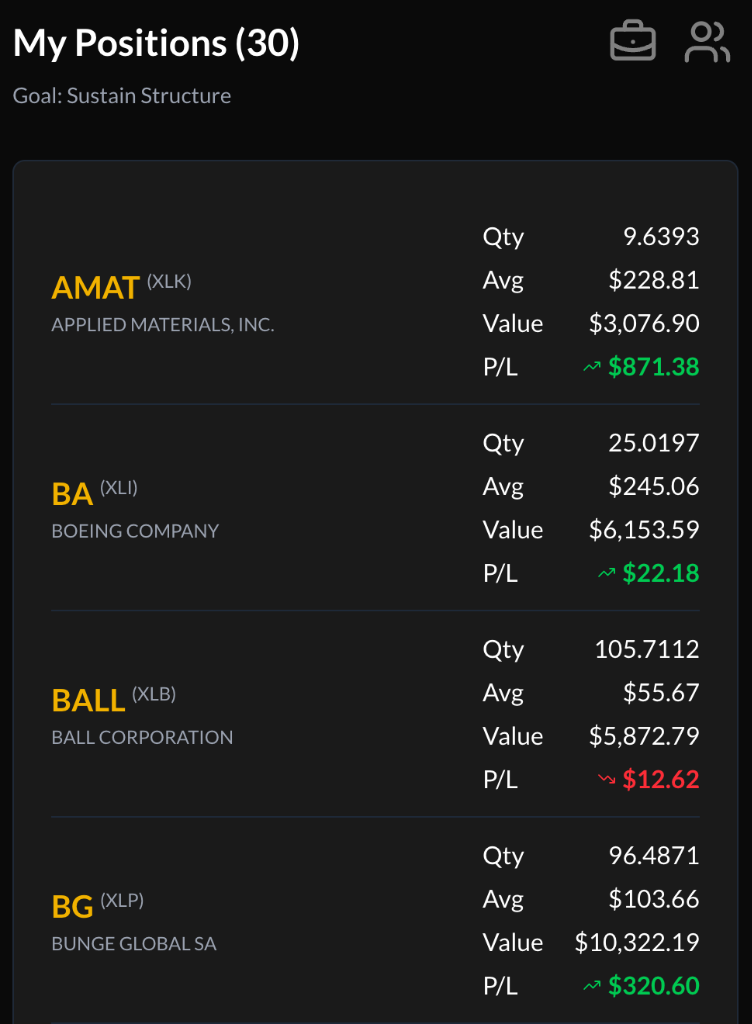
My Positions
The My Positions section displays securities currently held in your connected brokerage account or simulated trading environment.
MarketQuants does not execute trades independently and does not hold customer assets.
Position List
Positions are displayed in a structured list format.
- (Count): Indicates the number of positions currently held.
- Color Coding:
- Gold: Positions representing a larger proportion of total portfolio value.
- White: Smaller proportional positions.
- Sector Information: Displays the associated sector and company name.
Data Columns
Each position row displays:
- Quantity: Number of shares held (as reported by the brokerage provider).
- Average Price: Average cost basis per share.
- Market Value: Current total value based on latest available pricing.
- Profit / Loss (P/L): Difference between market value and cost basis.
Portfolio data reflects information retrieved from your connected brokerage account.
Sorting Options
Click the My Positions header to cycle through sorting methods:
- Alphabetical
- Quantity
- Average Price
- Market Value
- Profit / Loss
The active sorting metric is highlighted.
Trade Actions
Selecting a position opens the trade interface, where users may submit buy or sell instructions through their connected brokerage account.
All trade execution is handled solely by the brokerage provider.
Icons & Navigation
- Structure Indicator: Displays portfolio classification.
- Briefcase Icon: Links to portfolio analysis tools.
- Robots Icon: Links to sharing features.