Information Cards
The Information Cards present additional analytical data and historical performance context for a selected security.
Information Cards can be opened from a Leaderboard Tile or from within the Trading Interface.
1. Ticker Overview
The Overview card provides structured data about the selected security.
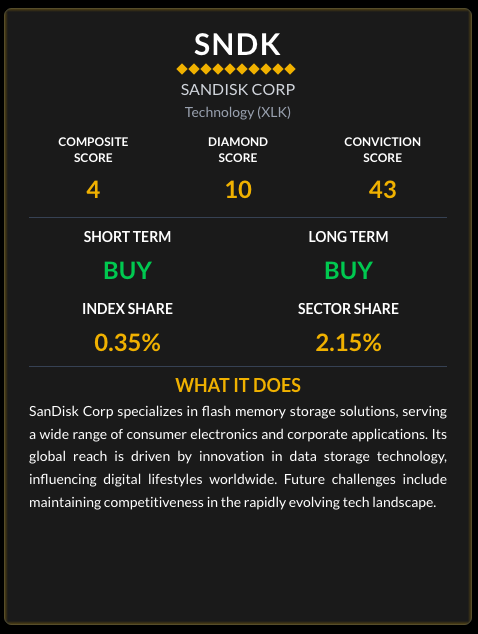
Quantitative Scores
MarketQuants displays three proprietary metrics:
- Composite Score: Overall ranking metric.
- Diamond Score: Structural price indicator (0–10 scale).
- Conviction Score: Trend-strength metric derived from predefined model rules.
These metrics are mathematical outputs and do not constitute investment recommendations.
Model Status Labels & Metrics
- Short-Term / Long-Term Status: Derived from predefined moving-average relationships.
- Index Share: Percentage weight of the company within its benchmark index.
- Sector Share: Percentage weight within its sector classification.
Company Description
A brief summary of the company’s business activities and products is provided for informational context.
2. Growth of a Dollar (vs Market)
This chart illustrates historical comparative performance against a broad benchmark index.
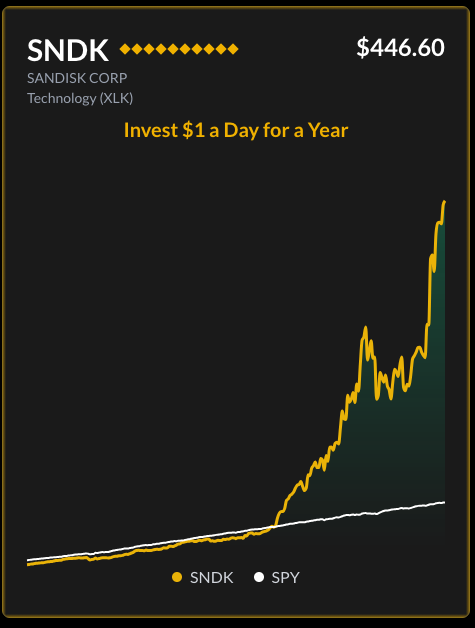
- The chart models hypothetical historical growth based on consistent periodic investment.
- One line reflects the selected security.
- One line reflects the benchmark index.
The visualization is descriptive of past performance only. Past performance does not guarantee future results.
3. Growth of a Dollar (vs Sector)
This chart compares historical performance relative to a sector benchmark.
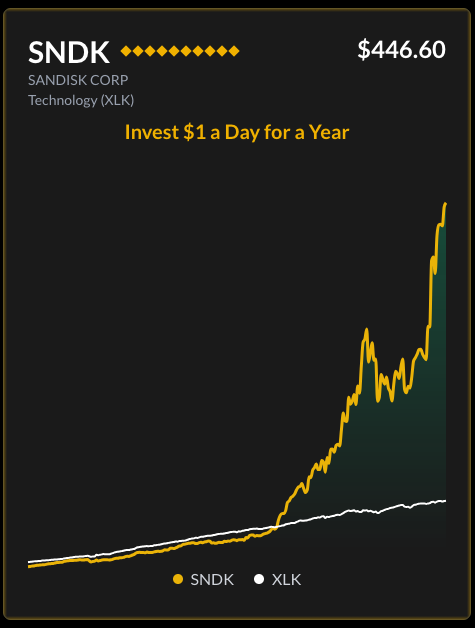
The comparison is intended to provide contextual data about relative historical performance within a sector classification.
Navigation
- Swipe or use navigation dots to move between cards.
- Swipe right-to-left or tap outside the card to close.